The Fleets Pulling Ahead in 2026 Aren't Spending More — They're Executing Better
What the latest industry benchmarks tell us about the fleets quietly pulling ahead — and the unglamorous operational habits they all share.

Key takeaways
- The fleets pulling ahead in 2026 aren't spending more — they're executing the operational basics measurably better: on-time PMs, fast work orders, and one connected system.
- Aging vehicles get expensive fast — maintenance runs about $0.20/mile in a vehicle's first five years but roughly $1.10/mile past ten — yet most fleets don't track cost-per-mile at the asset level.
- The bottleneck is execution, not strategy: the top blockers to on-time maintenance are communication gaps (~32%), technician availability (27%), and unscheduled work crowding out scheduled work (25%).
- Work orders move too slowly — a median 31 minutes to start and 6.7 days to complete — so every day shaved off the cycle effectively adds fleet capacity without buying a truck.
- Only about 6% of fleets use AI broadly today (versus ~53% researching it); the ones that benefit first are those that already consolidated clean maintenance, fuel, and telematics data.
The short version
If you've been following the industry chatter heading into 2026, you'd be forgiven for thinking the next twelve months are all about artificial intelligence, autonomy, and the great EV transition. Those stories are real, and they matter. But if you spend a few hours staring at the actual numbers coming out of fleets across North America right now, a much more practical pattern emerges.
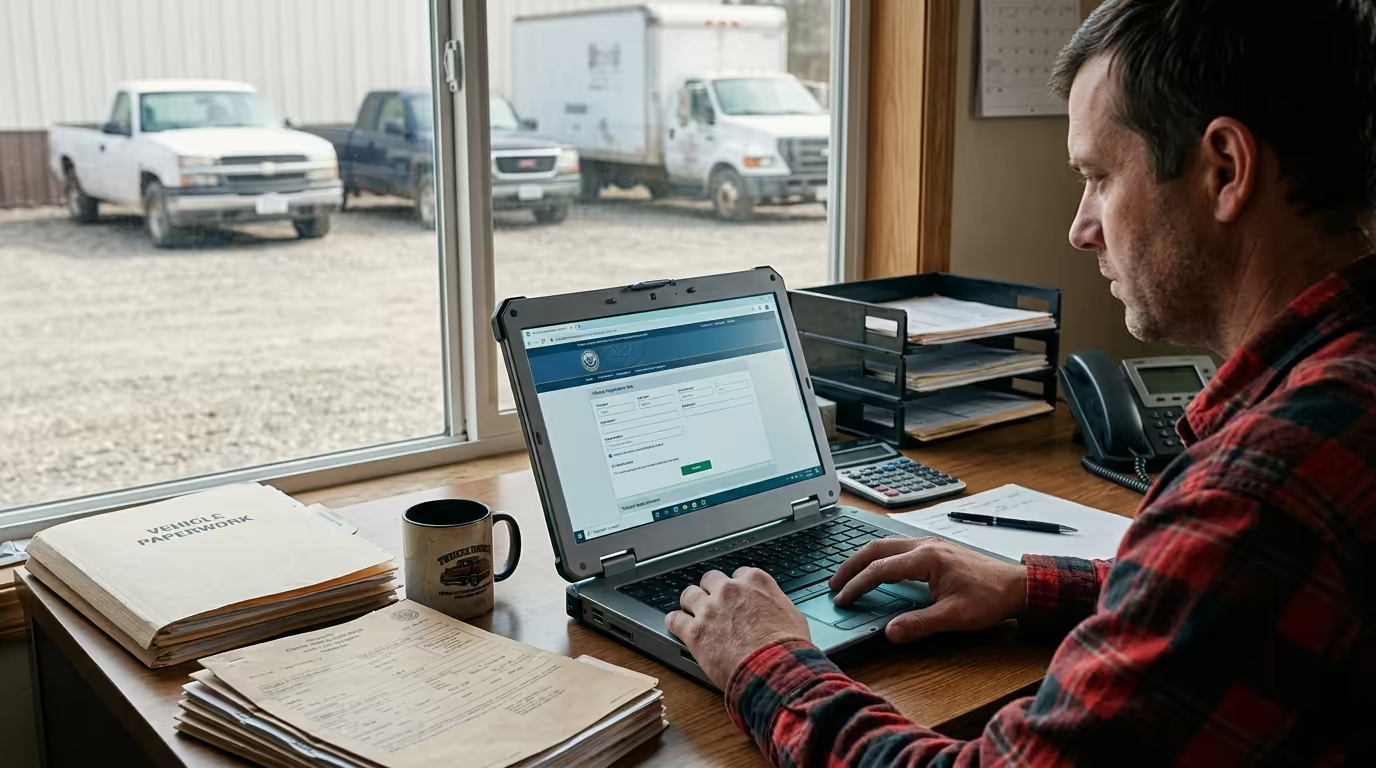
The fleets pulling ahead this year are not the ones with the newest trucks, the biggest tech budget, or the splashiest pilot programs. They're the ones quietly doing the operational basics measurably better than everyone else. Their preventive maintenance gets done on time. Their work orders move quickly. Their drivers, dispatchers, and shop teams talk to each other through the same system. They know, to the cent, what every vehicle in their fleet costs them per mile.
That's the headline coming out of the latest industry benchmarking — pulled from telematics and maintenance data on more than a million vehicles, billions of miles driven, and survey responses from hundreds of fleet leaders. Here's what stands out, and what we think it means for fleets planning their 2026 playbook.
The cost curve on aging vehicles is brutal — and most fleets are running blind
The data confirms what every shop foreman already suspects: a vehicle in its first five years of service costs around twenty cents per mile to maintain. Push that same vehicle past ten years and the per-mile maintenance cost climbs to roughly $1.10 — more than five times higher. That's not a gradual drift; that's a cliff.
The problem is that very few fleets are tracking cost per mile at the asset level. They track total fleet cost. They track downtime hours. They track parts spend. But they rarely have a clean view of which specific units are bleeding money — which makes replacement and reassignment decisions guesswork.
If you do nothing else this year, build the report that ranks every vehicle in your fleet by total cost per mile over the last twelve months. The bottom 10% of that list usually pays for itself many times over in replacement decisions.
The bottleneck isn't your maintenance plan — it's execution
When fleet managers were asked what actually prevents on-time maintenance, the answers had nothing to do with strategy. The top three blockers were communication gaps between drivers, managers, and shops (around 32%), technician availability (27%), and unscheduled service volume crowding out scheduled work (25%).
In other words: most fleets know what they should be doing. They have a PM schedule. They have intervals defined. The work just doesn't happen on time because a driver didn't flag the issue, a manager didn't see the alert, or a technician was already buried under emergency repairs.
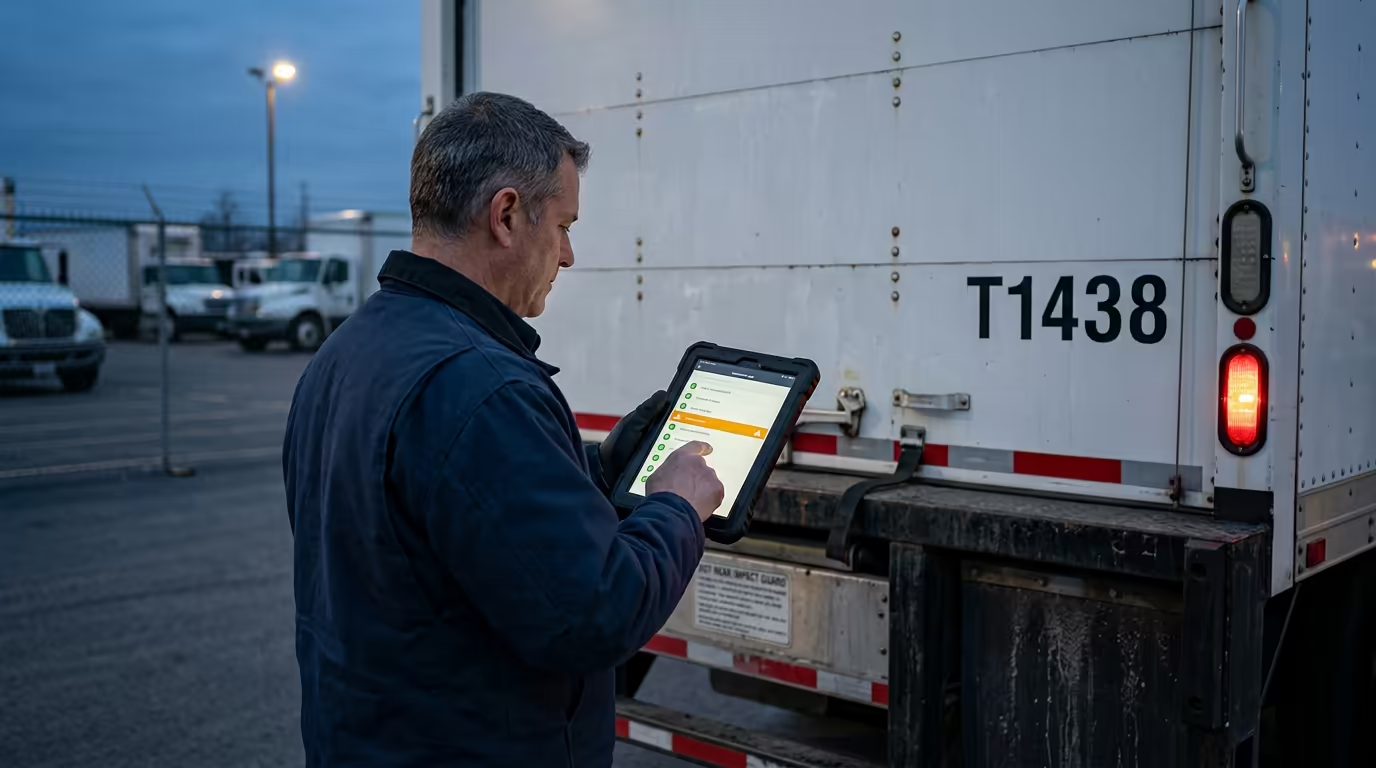
The fix here is workflow, not strategy. A digital DVIR that routes defects straight into the work-order queue closes the communication gap. Auto-generated PM tickets remove the "I forgot" failure mode. Capacity planning that reserves shop time for scheduled work — even when emergencies pile up — is what separates fleets that hit their PM compliance targets from fleets that perpetually miss them.
Work orders are moving too slowly
Two numbers worth committing to memory: across the industry, the median time to begin work on a new work order is 31 minutes, and the average time to complete one is 6.7 days. Both numbers translate directly into vehicles sitting in a yard instead of generating revenue.
Some of that is unavoidable — you wait on parts, you wait on a specialist, you wait on a warranty claim. But a lot of it is process drag: status updates that don't get logged, parts that aren't pre-staged, technicians who don't know what's next in their queue. If you can take even a day off your average work-order cycle, you've effectively added capacity to your fleet without buying a single new vehicle.
Track time-in-status as a KPI. The bottlenecks usually surprise people.
AI is here, but the discipline gap is real
Roughly 53% of fleet leaders surveyed say they are researching or piloting AI capabilities — predictive maintenance, route optimization, automated triage of inspection defects. Only about 6% are using AI broadly today. The most common reason for hesitation, by a wide margin, is concern about the accuracy and reliability of the outputs.
That hesitation is reasonable, but it's also a signal. AI models — whether for predicting a brake failure or for optimizing a route — only perform as well as the data underneath them. Fleets running on spreadsheets, paper inspections, and disconnected vendor portals don't have data clean enough to feed any model. Fleets that have already consolidated their maintenance, fuel, and telematics data into a single source of truth are the ones where AI actually pays off in 2026.
The lesson isn't "rush to adopt AI." It's "get your data house in order so that when you do adopt, the results are trustworthy."
What the top fleets have in common
Looking across the high-performing fleets in the dataset, four habits show up over and over:
A single source of truth for vehicles, work orders, fuel, and inspections — not a constellation of tools that don't talk to each other.
Preventive maintenance enforced by the system, not by memory. PMs trigger automatically based on miles, hours, or time, and the right technician is notified.
Driver inspections that flow directly into the work order queue. The driver finds it, the system routes it, the shop sees it — same day, no email chains.
Visibility into cost per asset and cost per mile, refreshed in near real time, so leadership can make replacement and reassignment calls based on the numbers in front of them.
The 2026 takeaway
Discipline over disruption. The technology stories — AI, autonomy, electrification — will keep dominating the headlines, and they're worth tracking. But the gains available to most fleets in the next twelve months come from doing the unglamorous fundamentals better: a tighter PM cadence, a faster work-order cycle, cleaner data, fewer vehicles past their economic prime.
If you only do one thing after reading this, do this: pick three KPIs — PM compliance percentage, average work-order cycle time, and cost per mile by asset — and start measuring them weekly. The fleets that measure tend to improve. The fleets that don't tend to drift. And in a year where margins are tight and costs are rising, drift is expensive. This is especially true for trucking fleets running tight margins on competitive lanes.
Start a free 14-day trial. No credit card, no usage caps.
Start free trial →